Contour Plot Excel
Advertisement

Contour Plot v.1 1
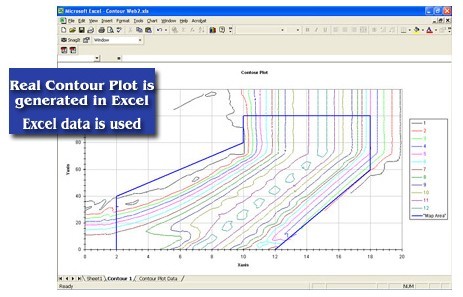
Real contour plots are created in Excel. You can interact with the contour plot just like any other Excel plot. Contour Plot works with any contour data. It accommodates rectangular data, nearly rectangular data, and irregular data.
Contour Plot for Excel v.1.01
Create real contour plots in Excel using any data (rectangular, nearly rectangular, or irregular data).

Visual Data v.3.6.0
Scientific data visualization software. Creating vertex, grid and surface model, color map, contour plot, vector plot, 4D scatter, 4D slice and 4D vector.

Visual Data For Academic v.3.2.0
Scientific data visualization software. Creating vertex, grid and surface model, color map, contour plot, vector plot, 4D scatter, 4D slice and 4D vector.
EZplot v.1 1
EZplot is an Excel add-in and trademark of Office Expander. The software design is targeted to improve productivity in creating Excel plots and performing data calculations in Microsoft Excel (from the Microsoft Office Suite).
PTC Mathcad Express v.3.1
PTC Mathcad Express is free-for-life engineering math software. You get unlimited use of the most popular capabilities in PTC Mathcad allowing you to solve, document, share and reuse vital calculations.
3DField v.3.7.3
This plotting software converts your data into contour maps and surface plots. It interpolates X, Y and Z data points onto a grid, orthogonally or within an arbitrary border. It also displays data points on a plane,
3DFieldPro v.2.9.2
Create contour maps. 3DField is a contouring surface plotting and 3D data software that runs under Microsoft Windows NT/XP/Vista/7. 3DField converts your data into contour maps and surface plots.
Wafermap v.3 2
WAFERMAP is an award winning software package used to collect, edit, analyze and visualize measured physical parameters on semiconductor wafers.

Visual Calculus v.3.9.2
Visual Calculus is an easy-to-use calculus grapher for Graphing limit, derivative function, integral, 3D vector, series, ode etc. Which can create 2D, 2.5D and 3D function graphs, animations and table graphs.